| Find in this manual | ||
| Replace with | ||
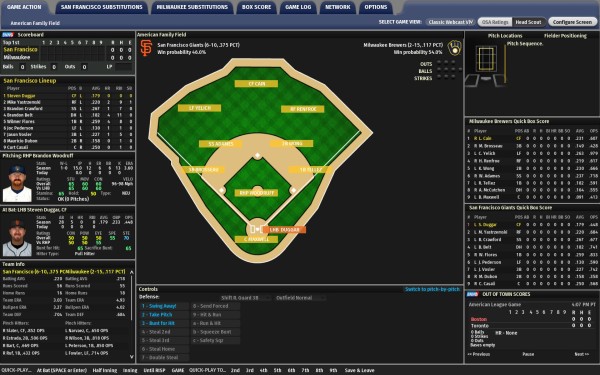
OOTP provides two styles of screens for your play-by-play experience, the Broadcast screen and the Classic Webcast screen. You can use either screen or switch between the two while playing. We've already covered the actual Play-by-Play Controls, so be sure you're familiar with those when you're ready to start playing!

Whereas the BNN Broadcast screen is a fairly graphical representation of a game, the Webcast screen is designed more for data lovers. The BNN Webcast screen includes a graphic of a hitter along with a pitch location indicator and a small stadium representation. Let's walk through the different sections on this screen, starting in the top left:
Scoreboard
The Scoreboard in the top left keeps track of the progress of the current game.
Team Box Scores
Below the scoreboard are two box score panes. They show lineups and statistics for the current game, for each team. The visiting team is shown on top, and the home team below. For the batting team, the player displayed in boldface is currently at bat. For the fielding team, the player displayed in boldface will be the first batter up in the next half-inning.
Team Info
The bottom left of the screen has relevant information about each team, including important information about how many pinch hitters and relievers are available on each team.
Batter's Box
The Batter's Box is a graphic of the current hitter. The graphic shows a hitter (on the correct side of the plate, based on his handedness) and a box that represents the strike zone. Each pitch thrown is represented by a circle on the graphic of the batter and the strike zone. The circles are numbered according to the pitch sequence. So, the first pitch thrown is represented by a circle with a '1,' the second pitch a '2,' and so forth. The pitches are further identified by color according to the result of the pitch.
| Color | Result |
| Red | Strike |
| Green | Ball |
| Yellow/Orange | Foul |
| Blue | Ball in play |
The bottom of this section contains a Pitch Sequence box as well, which describes the most recent pitches to the current batter, including the type of pitch and the speed.
Pitching Data
The Pitching Data underneath the Batter's Box displays a number of statistical categories for the current pitcher. Some of the statistics displayed change depending on the situation. For instance, if the count is 3-1, then the data will show this pitcher's statistics when the count is 3-1.
Stadium
The Stadium graphic in the top right displays all the defensive players and their defensive ratings, as well as any players who are on base. The current count and the number of outs are displayed in the bottom left, and a text description of the weather is included at the top of the screen. See How Weather Affects Games in OOTP for more information.
Batting Data
The Batting Data section displays a number of statistical categories for the current batter. Some of the statistics displayed change depending on the situation. For example, if it is the first inning, then the data will show this batter's statistics in innings 1-3.
Play-by-Play Control Pane
The Play-by-Play pane in the lower right, described in detail on the Play-by-Play screen, is where you make decisions and view the actual play-by-play results.